Building Convergence – A Journey from Network Observability to AI-Driven Automation Part 4: AI Threat Intelligence Service

Welcome back to the “Building Convergence” series! If you’ve been following along, Part 1 laid out the big-picture vision: nautobot as the golden source of truth, OpenTelemetry collecting everything, VictoriaMetrics/Loki/Grafana making it queryable and visual. Part 2 got the pipes in place—SNMP polling for Cisco switches, syslog ingestion from pfSense, GeoIP enrichment, and the first log-to-metrics counts. Part 3 turned that data into proactive defense: real-time Geomap threat plots, Loki ruler spike detection, Discord-paged alerts on country blocks or switch reboots, and cleanly separated Network/Security dashboards.
Now in Phase 4, we cross the line from observability into intelligent analysis. We introduce a dedicated threat-intel microservice that pulls the top blocked and outbound IPs from VictoriaMetrics, enriches them with external threat feeds (AbuseIPDB, GreyNoise, OTX, IPInfo), runs port analysis via Loki, feeds the context to Claude Haiku for pfSense-aware threat narratives and remediation recommendations, and surfaces everything in a brand-new “Threat Intelligence” Grafana dashboard using the Infinity datasource.
This is where the convergence really starts to feel magical—raw telemetry becomes contextual, AI-generated security intelligence tailored to your firewall. I’ll dive deep into the technical guts: configuration, Python code structure and snippets, metrics rationale, dashboard building, threat scoring logic, display mechanics, AI’s role, and the most painful bugs with their root causes and fixes.
All code lives in the Convergence repo on the phase4 branch. Spin it up with docker compose up -d --build after adding your API keys.
Overview
Phase 4 delivers:
- Automated IP Enrichment — Hourly job queries top blocked src IPs and outbound dst IPs, caches results (24h TTL), hits four threat intel APIs.
- Composite Scoring & Bad-Actor Flagging — Weighted score (0–100), RIOT-aware false-positive heuristics, outbound C2 detection.
- Port Attack Analysis — Loki LogQL extracts blocked ports from filterlog CSV, maps to known services (SNMP, RDP-Alt, etc.).
- Claude Haiku Narratives — pfSense-specific threat summaries, top threats with org/ASN context, false-positive flags, and exact remediation steps (Firewall Rules, pfBlockerNG lists, Diagnostics > States).
- Grafana Threat Intelligence Dashboard — Executive summary, AI narrative panels, scored IP tables, suspicious outbound views, port breakdowns—all via Infinity + VictoriaMetrics.
The service exposes Prometheus metrics (scraped by VictoriaMetrics) and JSON endpoints optimized for Infinity.
Architecture
VictoriaMetrics (firewall_events_total + threat_intel_* metrics) │ PromQL queries (top IPs, interfaces, ports) ▼ threat-intel service (FastAPI + APScheduler) :8001 ├─ Hourly + startup enrichment: │ ├─ Top 50 blocked src_ips + top 20 outbound dst_ips │ ├─ Active pfSense interfaces (for Claude context) │ ├─ Redis cache (24h TTL per IP) │ ├─ Enrich → AbuseIPDB / GreyNoise / OTX / IPInfo │ ├─ Loki port extraction from filterlog CSV │ └─ Claude Haiku → JSON narrative + actions ├─ /health, /metrics (Prometheus), /api/report, /api/infinity/* ▼ Infinity Datasource (proxy to threat-intel:8000) ▼ Grafana “Threat Intelligence” Dashboard ├─ Executive Summary (risk gauge, bad actor counts) ├─ AI Narrative (summary + pfSense actions) ├─ Inbound/Outbound Threat Scores ├─ Port Analysis (top ports, critical services) └─ Enriched IP Tables
All
/api/infinity/*endpoints return arrays—even single objects wrapped in[{}]. This is required for reliable Infinity backend-proxy behavior.
Configuration and Setup
To get this running, we add a new service to docker-compose.yml: the threat-intel container based on a custom Dockerfile (Python 3.11 slim with FastAPI, APScheduler, httpx, pydantic-settings, anthropic, prometheus_client, redis). It depends on Redis (for caching), VictoriaMetrics (for queries), and Loki (for ports).
Modified files include:
docker-compose.yml: New service + Grafana’s Infinity plugin viaGF_INSTALL_PLUGINS.config/victoriametrics/prometheus.yml: Scrape job for/metrics.config/grafana/provisioning/datasources/threat-intel.yaml: Infinity datasource with proxy access andallowedHosts.config/grafana/provisioning/dashboards/convergence.yaml: New “Threat Intelligence” folder..env: API keys (more below).
API keys are crucial—add them to .env and force-recreate the container to load them:
| Variable | Source | Free Tier | Required? |
|---|---|---|---|
ANTHROPIC_API_KEY |
Anthropic Console | Pay-per-token | Yes |
ABUSEIPDB_API_KEY |
AbuseIPDB | 1,000/day | Recommended |
GREYNOISE_API_KEY |
GreyNoise | ~60/min unauth | Optional |
OTX_API_KEY |
AlienVault OTX | Free | Recommended |
IPINFO_TOKEN |
IPInfo | 50k/month | Recommended |
Other env vars (in config.py via Pydantic):
| Variable | Default | Description |
|---|---|---|
ENRICHMENT_INTERVAL_SECONDS |
3600 | Hourly runs |
TOP_BLOCKED_IPS |
50 | Blocked to enrich |
TOP_OUTBOUND_IPS |
20 | Outbound to enrich |
CACHE_TTL_SECONDS |
86400 | 24h cache |
ABUSEIPDB_DAILY_BUDGET |
900 | Cap to avoid free-tier overage |
LOOKBACK_HOURS |
1 | PromQL window |
REDIS_URL |
redis://redis:6379/0 | Cache conn |
VICTORIAMETRICS_URL |
http://victoriametrics:8428 | Query base |
LOKI_URL |
http://loki:3100 | Port query base |
DATA_DIR |
/app/data | For port_services.json |
The Python Code: Structure and Key Snippets
The service is a FastAPI app in services/threat-intel/app/main.py, modularized for maintainability:
main.py: FastAPI routes (/health,/metrics,/api/report,/api/infinity/*)scheduler.py: APScheduler background job (startup + hourly)state.py: Globallatest_reportdict (shared between scheduler and API)metrics.py: Prometheus gauges/countersmodels.py: Pydantic schemasenrichment/: Cache, API clients, aggregatoranalysis/: VM PromQL client, Loki port extraction, Claude prompt builder
Core flow (enrich_and_analyze() in scheduler):
- Query VictoriaMetrics for top blocked/outbound IPs + interfaces
- Check Redis cache (24h TTL)
- Enrich uncached IPs async (with rate guards)
- Aggregate composite scores + flags
- Extract ports from Loki
- Build Claude prompt → generate narrative
- Update
latest_report+ set Prometheus metrics
Example aggregator snippet:
1
2
3
4
5
6
7
8
9
10
11
12
13
def aggregate_enrichment(ip: str, sources: dict) -> dict:
    abuse_score = sources.get('abuseipdb', {}).get('abuseConfidenceScore', 0)
    otx_pulses = sources.get('otx', {}).get('pulse_count', 0)
    gn_class = sources.get('greynoise', {}).get('classification', 'benign')

    composite = (
        abuse_score * 0.5 +
        min(otx_pulses, 20) / 20 * 30 +
        {'malicious': 20, 'unknown': 5, 'noise': 5}.get(gn_class, 0)
    )

    level = 'critical' if composite >= 75 else 'high' if composite >= 50 else ...
    return {'composite_score': composite, 'threat_level': level, ...}
Claude prompt builder excerpt:
1
2
3
4
5
6
7
8
9
10
11
12
prompt = f"""
Analyze this pfSense firewall data:
- Overall risk: {summary['overall_risk_level']}
- Top blocked IPs: {json.dumps(top_blocked[:15])}
- Suspicious outbound: {json.dumps(suspicious_outbound)}
- Interfaces: {interfaces}
- Top ports: {top_ports}
- Note: Outbound src_ips are NAT'd—use Diagnostics > States to find internal hosts.

Generate JSON with: executive_summary, top_threats (flag FPs), recommended_actions (pfSense paths like Firewall > Rules > igc0.201).
Avoid blocking benign orgs unless abuse >50.
"""
Rate guards:
- AbuseIPDB: Redis daily counter caps at 900 calls
- GreyNoise:
asyncio.Semaphore(3) + 0.15s sleepinside lock
Prometheus Metrics: What, Why, and Labels
Exposed at /metrics, scraped into VictoriaMetrics for health monitoring and dashboard trends.
| Metric | Labels | Why? |
|---|---|---|
| threat_intel_ip_score | “ip, direction, country, org, classification” | Per-IP risk timeseries |
| threat_intel_ip_event_count | “ip, direction, action” | Event volume context |
| threat_intel_abuseipdb_score | “ip, direction” | Source-specific trends |
| threat_intel_otx_pulses | “ip, direction” | Malware association tracking |
| threat_intel_greynoise_classification | “ip, direction (2=malicious, etc.)” | Behavior categorization |
| threat_intel_known_bad_actor | “ip, direction, country” | Quick bad-actor filtering |
| threat_intel_port_event_count | “port, port_service, risk_level” | Port attack volume/risk |
| threat_intel_enrichment_last_success_timestamp | — | Health monitoring |
| threat_intel_enrichment_ips_processed_total | — | Cycle efficiency |
| threat_intel_cache_hits_total | — | Cache effectiveness |
Important: Renamed service → port_service to avoid scrape-config overwrite. Restart VictoriaMetrics after adding scrape job.
Threat Scores: Logic, Sources, and Rationale
Composite Score (0–100): Balanced view avoiding single-source bias.
| Component | Weight | Source | Rationale |
|---|---|---|---|
| AbuseIPDB confidence | 50% | /v2/check | Crowd-reported abuse—highest weight for real-world signal |
| OTX pulse count | 30% | /api/v1/indicators/IPv4/… | Malware/IOC associations—capped at 20 to dampen outliers |
| GreyNoise classification | 20% | /v3/community/{ip} | “Scanner/malicious behavior—RIOT flags benign infra (e.g., CDNs)” |
Levels: none (<10), low (10–24), medium (25–49), high (50–74), critical (75+) Outbound C2 flagging: is_known_bad_actor=true if OTX >2 OR Abuse >20 OR GreyNoise malicious OR score >30 (non-RIOT). False-positive heuristic: GreyNoise RIOT OR org matches big-tech list → likely_false_positive=true. Claude adjusts recommendations. Why these sources? Free tiers, complementary signals, no paid subs required.
Building the Grafana Dashboard
Dashboard: dashboards/threat-intel/threat-intelligence.json (UID: threat-intelligence-v1)
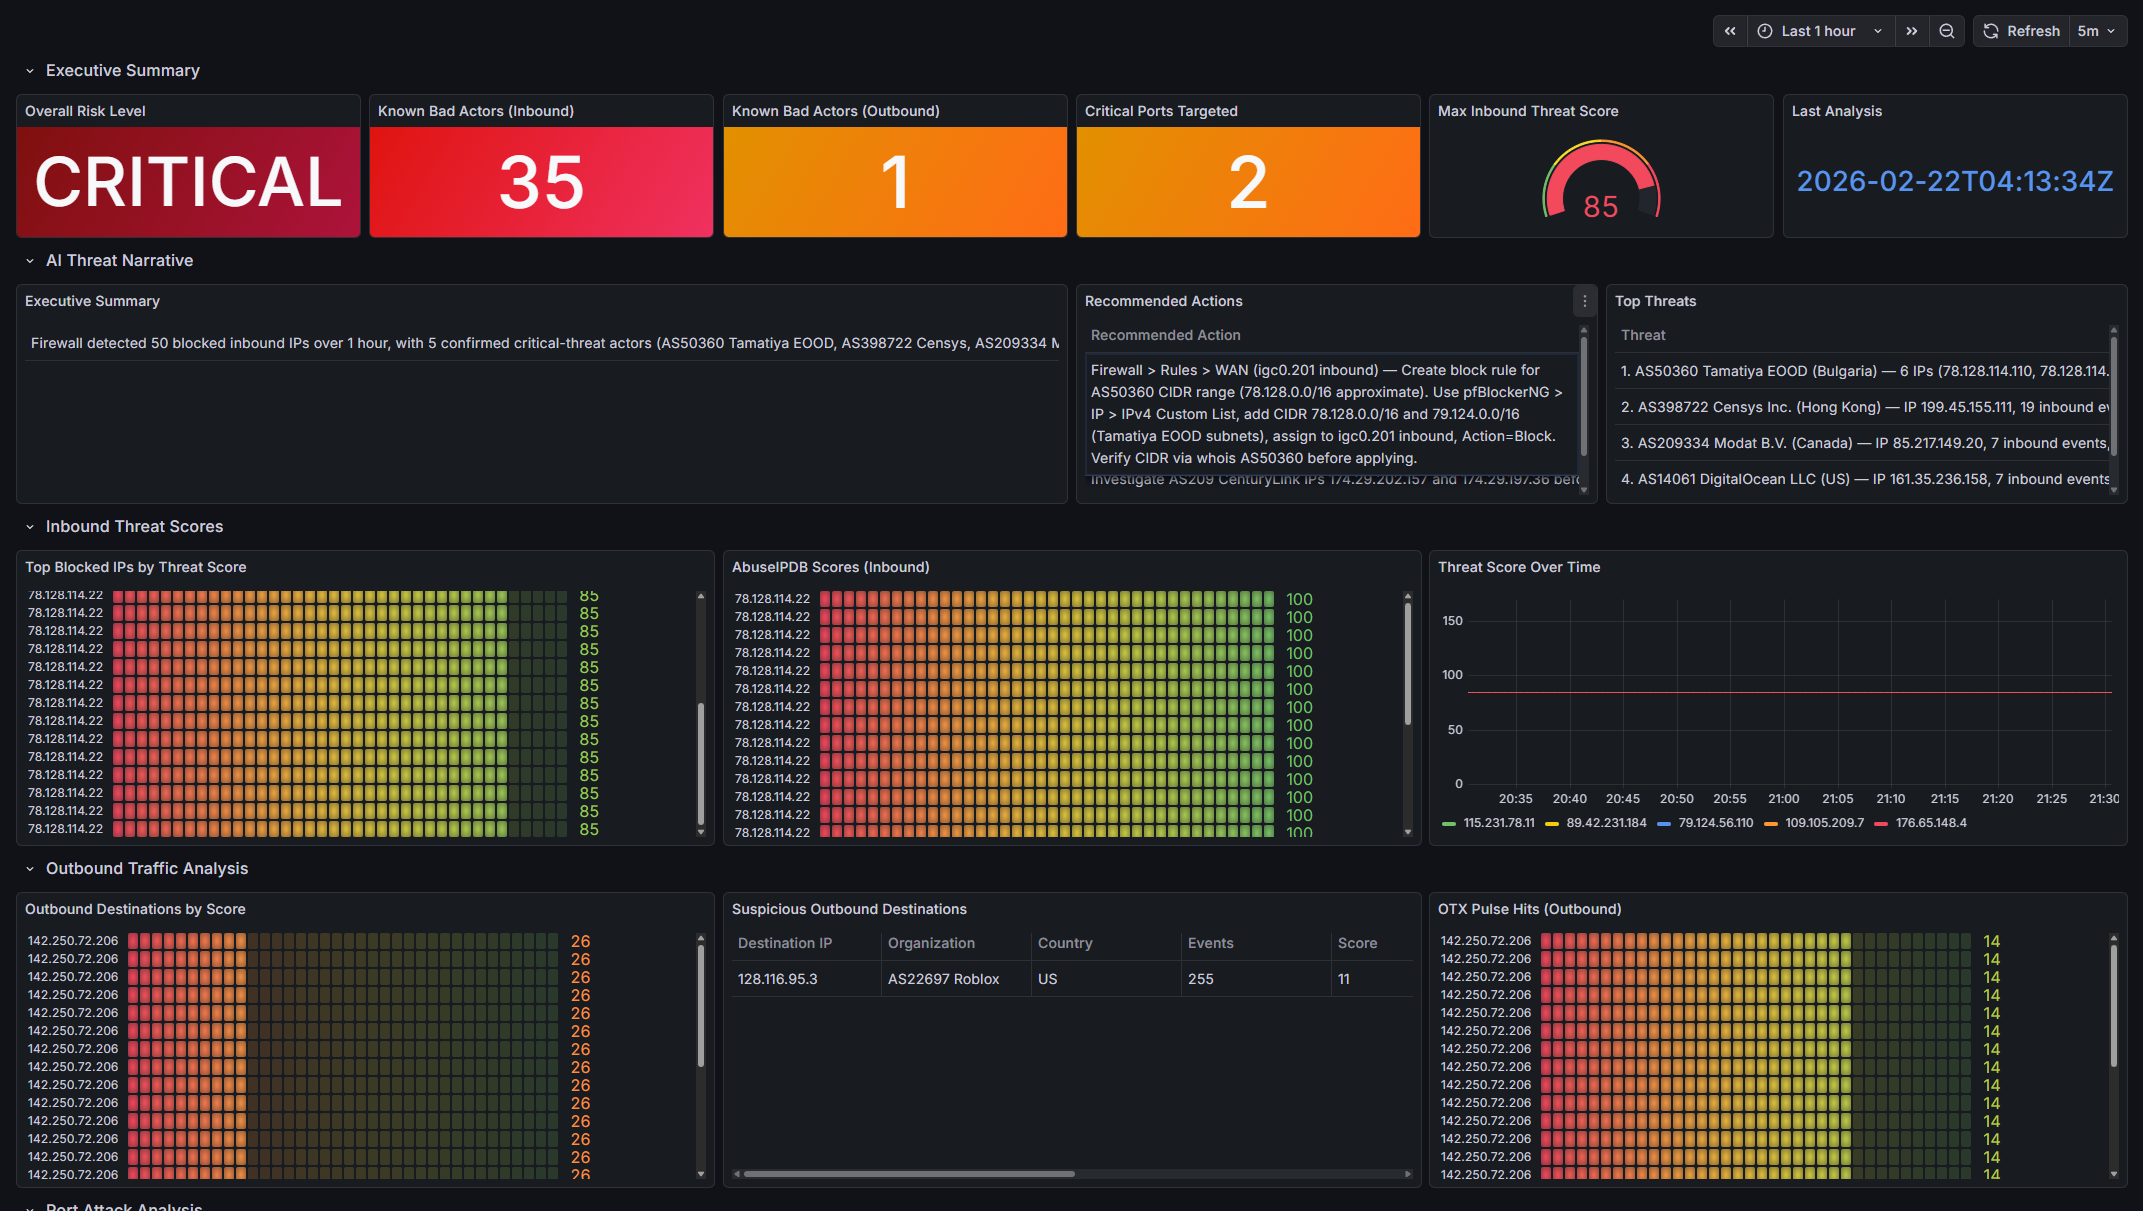
Rows & Panels:
- Executive Summary: Risk stat, bad actor counts, critical ports, max score gauge, timestamp
- AI Threat Narrative: Summary + actions table + top threats
- Inbound Threat Scores: Top IPs, AbuseIPDB trend, score timeseries
- Outbound Traffic Analysis: Suspicious (pre-filtered), all outbound, OTX hits
- Port Attack Analysis: Top ports bar, critical table, risk pie
- Enriched IP Tables: Blocked & outbound flat lists
- Service Health: Enrichment timestamp, IPs processed, cache hits
Key techniques:
- VictoriaMetrics: topk(10, threat_intel_ip_score{action=”block”}) etc.
- Infinity: Full URLs (http://threat-intel:8000/api/infinity/…), array responses, flat JSON, text = selector for stat panels
- Fix UID mismatch: Query /api/datasources, replace in JSON
Infinity gotchas: Relative URLs fail, objects need array wrap, nested selectors don’t work in proxy, booleans filter as strings (pre-filter API-side).
How It’s Displayed
- Stats/gauges for quick risk/bad-actor overview
- Tables for detailed IPs (ip, score, org, country, flags)
- Timeseries for score trends
- Bars/pies for port distribution/risk
- Table panels for AI narrative (exec summary, threats, actions)
All auto-refresh—Infinity proxies for fresh data.
AI’s Role: Contextual Intelligence
Claude Haiku takes enriched data + pfSense context (interfaces, NAT note) and produces:
- Executive summary
- Per-threat analysis (why risky/FP, org/ASN)
- Remediation steps: exact pfSense UI paths (Firewall > Rules > igc0.201, pfBlockerNG ASN lists, Diagnostics > States)
Prompt engineering ensures tailored output. Token budget: 2000 for detailed actions. Why AI? It connects dots: flags FPs, suggests ASN blocks for clusters, handles NAT limitation intelligently.
The prompt passes to Claude:
- Summary counts (blocked IPs, bad actors, risk level)
- Top 15 blocked IPs with: country, org, ASN, composite score, abuse score, OTX pulses,
GreyNoise classification, RIOT flag,
likely_false_positiveheuristic flag - All outbound destinations with same enrichment fields
- Suspicious outbound subset (is_known_bad_actor=true)
- Active pfSense interface names from VictoriaMetrics (e.g.
igc0.201,lagg0.102) - Top 10 targeted ports with service and risk level
- Note explaining pfSense NAT masks internal source IPs
pfSense-specific instructions given to Claude
Claude is instructed to:
- top_threats: For each threat, name the IP, org/ASN, why it is or isn’t a real threat, flag false positives explicitly, include CIDR/ASN context
- recommended_actions: Use exact pfSense UI paths with real interface names:
- Single IPs:
Firewall > Rules > [INTERFACE] — add block rule for [IP], direction [in/out] - ASN ranges:
pfBlockerNG > IP > IPv4 — add custom CIDR list for AS[NUMBER] - Suspicious outbound (source unknown due to NAT):
pfSense Diagnostics > States — filter by [DST_IP] - Never recommend blocking known-benign orgs (Google, Apple, etc.) unless abuse_score > 50
- Single IPs:
Bugs, Root Causes, and Hard-Won Lessons
Building the threat-intel service produced lots of failures. Most were silent issues (blank panels, overwritten labels, empty LLM output, rate-limit storms) rather than crashes.
The table below groups them by category and summarizes the most instructive ones:
| Category | Bug / Symptom | Root Cause | Fix Summary | Key Lesson / Takeaway |
|---|---|---|---|---|
| API Rate Limiting & LLM Reliability | GreyNoise 429 flood after ~10 IPs | 70 IPs → ~70 concurrent GreyNoise calls in <1s (exceeds ~60/min limit) | Module-level asyncio.Semaphore(3) + 0.15s delay inside the lock |
Concurrent external calls need global coordination; put delays inside semaphores |
| Claude returned empty string instead of JSON | Sparse input (many 429s) caused model to emit empty content | Guard: if not raw_text: return {"error": "empty_response"} + log stop_reason |
LLMs can fail silently even with strong instructions—always add empty-body checks | |
| Claude wrapped JSON in ```json fences | Model habit not fully suppressed by prompt | Post-process: strip fences if present | Normalize LLM structured output defensively; instructions alone are not enough | |
| Infinity Datasource Gotchas | Relative URLs → https:///api/report (no Host error) |
Go backend does not prepend base_url; requires absolute URLs |
Use full URLs in every panel target + add url & allowedHosts to datasource YAML |
Never rely on relative URLs with backend-proxy plugins |
| JSON objects → blank stat panels | Infinity backend is array-first; single objects produce zero rows | Return 1-element arrays from API: return [summary_dict] |
Design API responses for the weakest consumer (Infinity Go backend) | |
| Stat panels “No Data” despite correct data | Infinity uses column text (not selector) as DataFrame field name |
Set text = selector (snake_case); use overrides for display names |
Match reduceOptions.fields regex to text property, not selector |
|
| Text panels stuck on “Loading…” | "type": "text" panels are static—targets are never executed |
Switch to "type": "table", showHeader: false, wrap: true |
Use table panels for dynamic markdown-like content | |
Nested selectors (intel.country) return nothing |
Go backend treats selectors as literal keys, not paths | Flatten JSON server-side ("country": "US" instead of nested) |
Flatten early when using backend-proxy datasources | |
| Observability Pipeline Assumptions | Loki port query returns zero results | Assumed non-existent labels (action, log_type) — only job, etc. exist |
Use line filters (|~) + positional regexp; verify labels via API |
Always check actual labels with /loki/api/v1/labels before writing LogQL |
| Regexp captured TCP options, not dst_port | End-of-line anchor (\d+$) grabbed window scale value |
Positional regexp anchored around field [21]: ,(?:tcp|udp),...(?P<dst_port>\d+), |
Use structure-aware (positional) regex for CSV/log formats | |
All port metrics labeled service="threat-intel" |
Scrape config service: 'threat-intel' overwrote metric-level label |
Rename label to port_service |
Avoid Prometheus-reserved label names (service, job, instance) |
|
| Outbound src_ip always = WAN IP (NAT hiding internal sources) | pfSense WAN logging is post-NAT | Accept limitation; label as “pfSense NAT (x.x.x.x)”; instruct Claude to recommend Diagnostics > States | Know exactly where logs are captured relative to NAT |
These lessons were expensive in time but saved far more in future debugging. If you’re building something similar, prioritize:
- Verifying labels and datasource behavior early
- Flattening JSON for Infinity
- Global rate limiting for external APIs
- Defensive LLM output parsing
Live Data Snapshot (2026-02-22, 1-hour window)
Deployment Steps
First-time setup
1
2
3
4
5
6
7
8
9
10
11
# 1. Add API keys to .env
# ANTHROPIC_API_KEY, ABUSEIPDB_API_KEY, OTX_API_KEY, IPINFO_TOKEN, GREYNOISE_API_KEY

# 2. Build and start
docker compose up -d --build threat-intel

# 3. Restart VictoriaMetrics to reload prometheus.yml scrape config
docker compose restart victoriametrics

# 4. Force-recreate Grafana to install Infinity plugin + load new datasource
docker compose up -d --force-recreate grafana
After adding/changing API keys
1
docker compose up -d --force-recreate threat-intel
After changing app/ Python code
1
docker compose build threat-intel && docker compose up -d --force-recreate threat-intel
After changing dashboard JSON
Grafana auto-reloads provisioned dashboards every 30 seconds. No restart needed.
After changing datasource YAML
1
docker compose up -d --force-recreate grafana
Verification
1
2
3
4
5
6
7
8
9
10
11
12
13
14
15
16
17
18
19
20
21
22
23
24
25
26
27
28
29
30
31
32
33
34
35
36
37
# Service health
curl http://localhost:8001/health
# → {"status":"ok","report_available":true}

# Wait for enrichment (up to 60s after startup)
curl http://localhost:8001/api/infinity/summary

# Port analysis working
curl http://localhost:8001/api/infinity/ports | python3 -c "
import sys,json; d=json.load(sys.stdin)
print(f'{len(d)} ports detected')
for p in d[:5]: print(f'  port={p[\"port\"]:6} service={p[\"service\"]:15} risk={p[\"risk_level\"]}')"

# Suspicious outbound with source
curl http://localhost:8001/api/infinity/outbound_suspicious | python3 -m json.tool

# pfSense-specific recommendations
curl http://localhost:8001/api/infinity/actions | python3 -c "
import sys,json
for a in json.load(sys.stdin): print('•', a['action'])"

# VictoriaMetrics scraping port metrics with correct label
curl -s 'http://localhost:8428/api/v1/query?query=threat_intel_port_event_count' | python3 -c "
import sys,json
for m in json.load(sys.stdin)['data']['result'][:5]:
    print(m['metric'].get('port'), m['metric'].get('port_service'), m['metric'].get('risk_level'))"

# Redis cache populated
docker exec convergence-redis redis-cli KEYS 'threat-intel:ip:*' | wc -l

# Claude narrative
curl -s http://localhost:8001/api/report | python3 -c "
import sys,json; r=json.load(sys.stdin); n=r['narrative']
print('available:', n['available'], '| risk:', n.get('risk_level','N/A'))"

# Service logs
docker logs convergence-threat-intel --tail 50
Wrapping Up and Next Steps
Phase 4 turns firewall logs into AI-powered, pfSense-aware intelligence. No more guessing “is this bad?”, Claude tells you with context and steps.
Next up in Phase 5: event-driven automation, turning these high-risk alerts into automatic pfBlockerNG list additions and dynamic anomaly baselines.
If you have questions or suggestions, hit me up on X @byrn_baker or on LinkedIn. Stay tuned!