Building Convergence – A Journey from Network Observability to AI-Driven Automation Part 3: Data Enrichment and Alerting
Welcome back to the “Building Convergence” series! In Part 1, we outlined the vision: nautobot as the single source of truth, OpenTelemetry (OTEL) as the telemetry hub, and a suite of open-source tools like VictoriaMetrics, Loki, and Grafana for storage, querying, and visualization.
Part 2 got our hands dirty with the foundational infrastructure—setting up the Docker Compose environment, ingesting SNMP and syslog data via OTEL, enriching logs with GeoIP metadata, and converting key events to metrics for efficient querying.
Now, in Part 3, we’re taking that enriched data and turning it into actionable intelligence. We’ll dive into real-time threat mapping using IP location data, set up spike detection with Loki’s ruler, configure intelligent alerting through Grafana and Alertmanager, and reorganize our dashboards for better usability. This phase bridges the gap from passive observability to proactive monitoring, laying the groundwork for automation in Phase 4.
All code and configs for this phase are in the Convergence repo main branch. If you’re following along, pull the latest changes and spin up the stack with docker compose up -d.
Overview
Phase 3 builds on the geo-enriched firewall logs introduced in Phase 2 to deliver:
- LogQL Spike Detection — Loki ruler evaluates LogQL queries on a schedule and fires alerts when attack patterns from specific regions exceed thresholds.
- Grafana Geo-Visualization — The existing Geomap panels on the pfSense Security Dashboard now have richer Loki label support for LogQL-based exploration alongside the VictoriaMetrics metric data.
- Intelligent Alerting — Provisioned Grafana alert rules cover country-based block spikes, overall firewall volume spikes, and switch uptime/reachability events. Alerts route to Alertmanager, then to webhooks or email.
- Dashboard Reorganization and New Panels — Dashboards are split into Network and Security Grafana folders. Two new dashboards added: Threat Analysis (country breakdown, attack trends) and Network Device Health (uptime, error rates, bandwidth).
This implementation is fully operational as of today (updated: Loki ruler path fix, dashboard reorganization, new panels, Discord alerting, alert rule datasource UID fix). Let’s break it down.
Architecture
Here’s the high-level flow, expanding on Phase 2’s pipeline:
1
2
3
4
5
6
7
8
9
10
11
12
13
14
15
16
17
18
19
20
21
22
23
24
25
26
27
28
29
30
31
32
33
34
35
36
37
38
39
40
41
42
43
44
45
46
47
48
49
50
51
pfSense Firewall (filterlog syslog)
        │
        ▼
OpenTelemetry Collector
  ├─ Parse filterlog: extract src_ip, dst_ip, action, interface, proto_name
  ├─ GeoIP enrich: add src_lat, src_lon, src_country, src_city
  ├─ count/firewall connector → firewall_events_total metric (with geo labels)
  └─ file/syslog → /data/syslog/syslog.jsonl (OTLP JSON)
        │                         │
        ▼                         ▼
VictoriaMetrics              Promtail
(firewall_events_total        ├─ Regex extract labels from OTLP JSON:
 with src_lat, src_lon,       │   action, log_type, src_country,
 src_country labels)          │   src_country_code, interface
        │                     └─ Push structured logs to Loki
        │                               │
        ▼                               ▼
Grafana Unified Alerting           Loki Ruler
  ├─ Alert: Country block spike     ├─ Recording rules → pre-agg metrics
  ├─ Alert: Total block spike       └─ Alert rules → Alertmanager
  ├─ Alert: Switch rebooted                  │
  └─ Alert: Switch SNMP down                 ▼
        │                            Alertmanager
        │                            ├─ Route: critical → Discord (1h repeat)
        │                            ├─ Route: team=security → Discord (4h repeat)
        │                            └─ Route: team=network → Discord (6h repeat)
        ▼
Grafana Dashboards
  ├─ Security/ folder
  │   ├─ pfSense Security Dashboard
  │   │   ├─ Geomap: WAN Threats (firewall_events_total + src_lat/lon)
  │   │   ├─ Geomap: Traffic Destinations
  │   │   ├─ Top Blocked IPs table
  │   │   └─ Firewall Actions timeseries
  │   └─ Threat Analysis Dashboard
  │       ├─ Stats: total blocks / attacking countries / block rate
  │       ├─ Top 10 countries (horizontal bar)
  │       ├─ Protocol distribution (donut)
  │       ├─ Attack rate by country (timeseries)
  │       ├─ Blocks by interface (stacked timeseries)
  │       └─ All attacking countries table
  └─ Network/ folder
      ├─ Interface Utilization
      ├─ Interface Errors
      ├─ Network Overview
      ├─ Platform Health
      └─ Network Device Health Dashboard
          ├─ Per-device uptime stats
          ├─ Uptime history (reboot detection)
          ├─ Interface error rates (table + timeseries)
          └─ Total bandwidth per device
This architecture ensures data flows efficiently from ingestion to visualization and alerting, with minimal overhead.
Part A: Real-Time Threat Mapping with IP Data
Building directly on Phase 2’s GeoIP enrichment, we now use the firewall_events_total metric and Loki labels to create interactive geo-visualizations in Grafana.
How the Geomap Works
The firewall_events_total metric carries rich labels from every parsed filterlog entry:
| Label | Description | Example | |
|---|---|---|---|
| action | Firewall decision | “block/pass” | |
| src_ip | Source IP address | 1.2.3.4 | |
| src_lat | Source latitude (GeoIP) | 39.9042 | |
| src_lon | Source longitude (GeoIP) | 116.4074 | |
| src_country | Source country name (GeoIP) | China | |
| dst_ip | Destination IP | 192.168.100.1 | |
| dst_country | Destination country | United States | |
| interface | pfSense interface | igc0.201 | |
| proto_name | Protocol | “tcp | udp” |
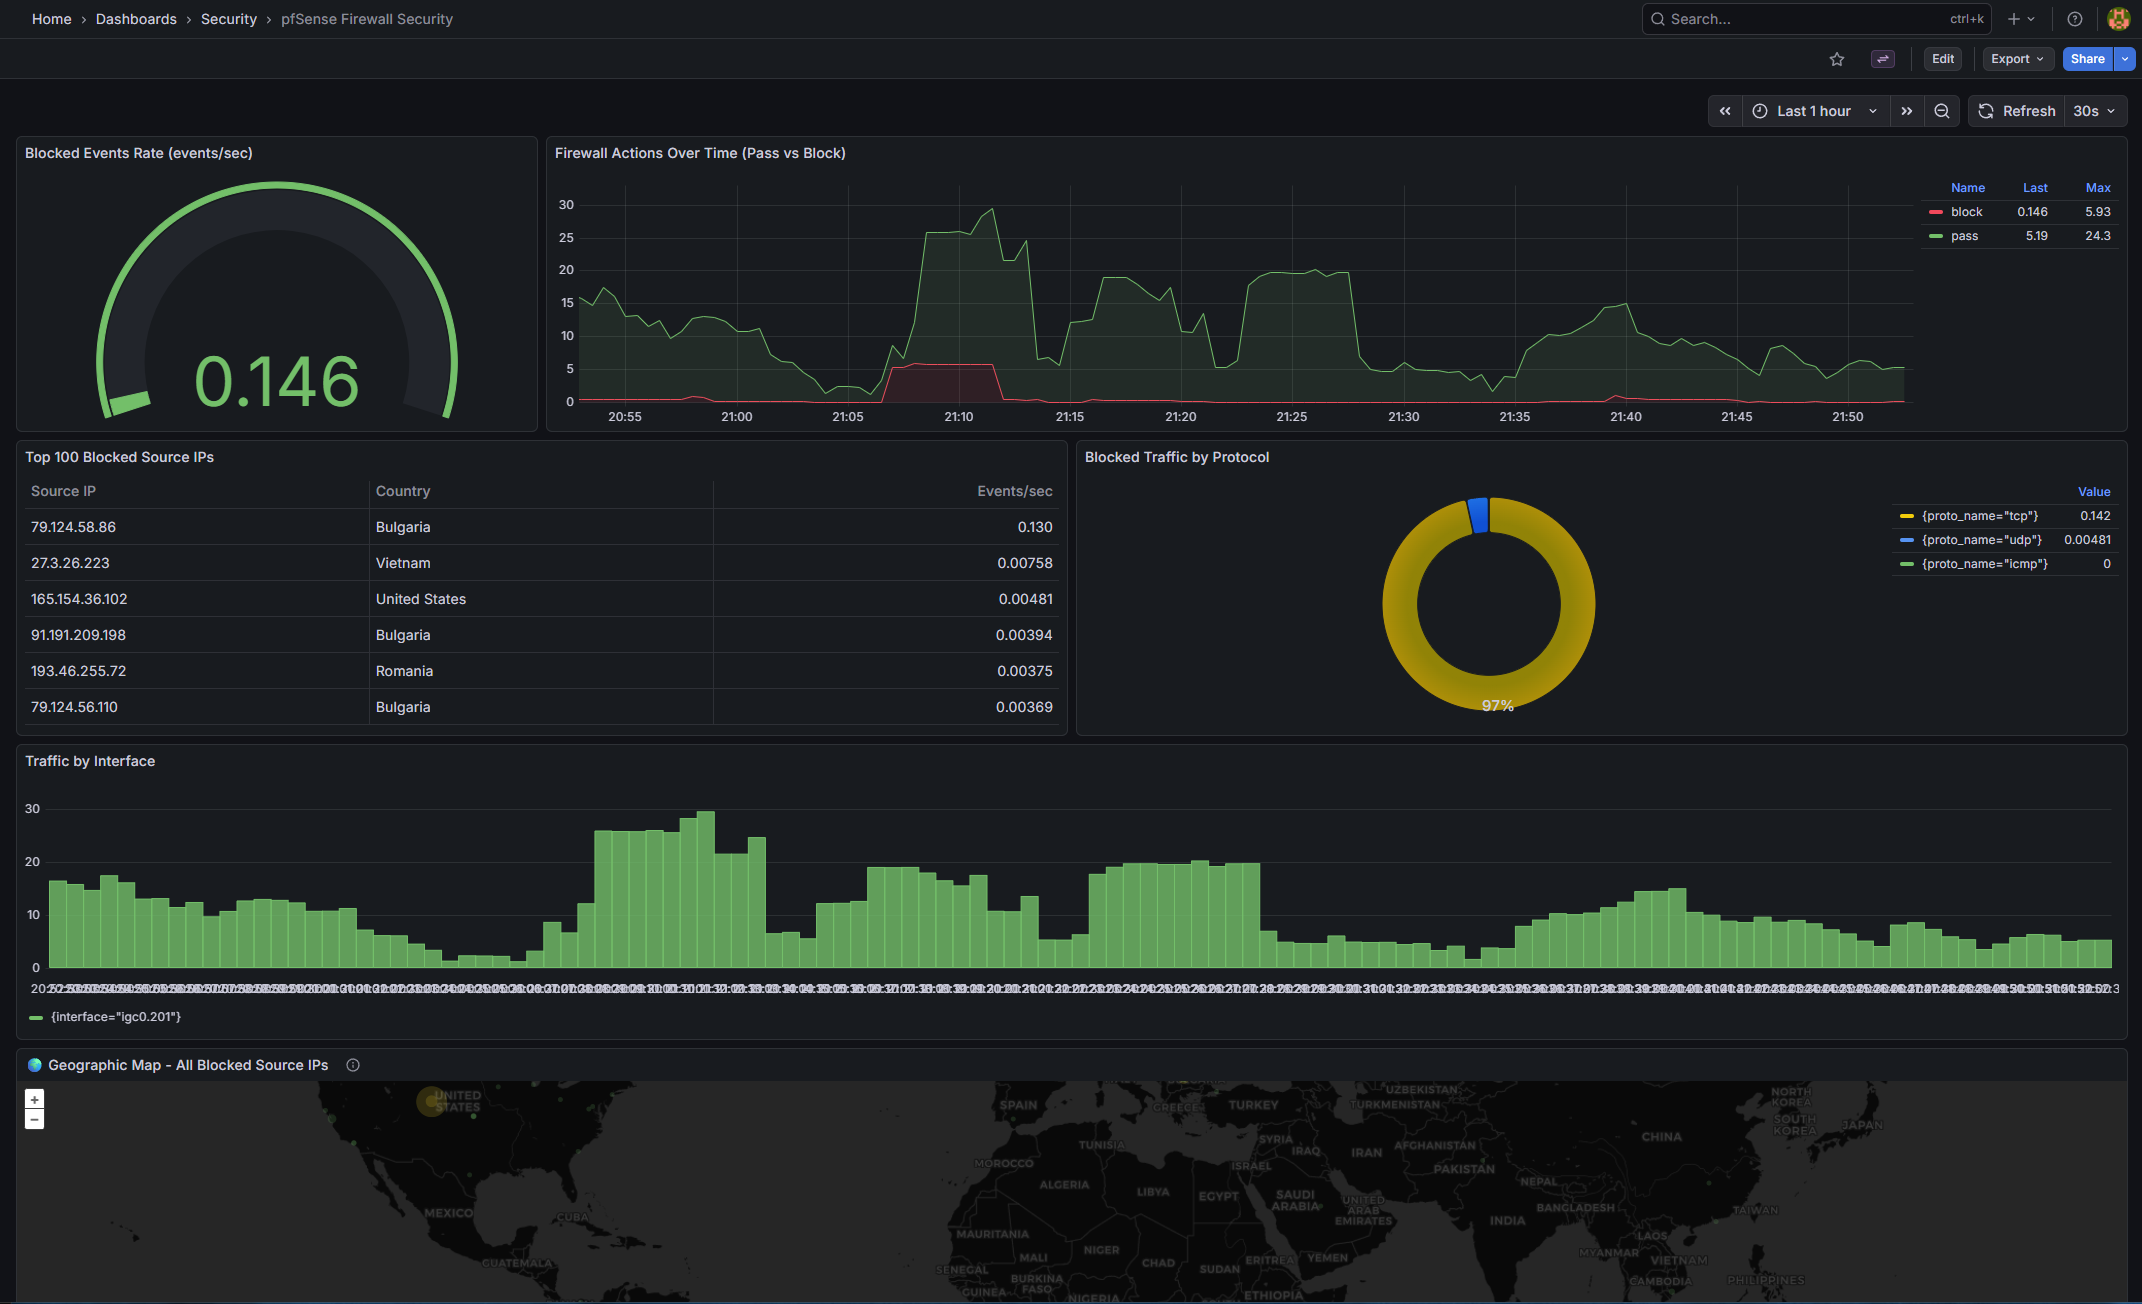
In the pfSense Security Dashboard, the Geomap panel for WAN Threats uses this PromQL query in instant mode with format=table:
topk(100,
  sum by (src_ip, src_lat, src_lon, src_country) (
    increase(firewall_events_total{
      action="block",
      direction="in",
      interface="igc0.201",
      src_ip!~"^(10\\.|172\\.(1[6-9]|2[0-9]|3[01])\\.|192\\.168\\.)"
    }[2h])
  )
)
Grafana transforms this into a table with columns like src_lat, src_lon, src_country, src_ip, and Value (block count). The Geomap layer maps these to coordinates, with bubble sizes scaled by block volume. Hovering over a bubble reveals the IP and country details—perfect for spotting clustered attacks.
Useful LogQL Queries for Threat Exploration
With Promtail extracting labels like action, src_country, and interface from the OTLP JSON logs, you can drill down in Grafana’s Explore view:
- View all block events from a specific country:
{job="syslog", log_type="firewall", action="block", src_country="China"} - Count blocks per country over the last hour”
sum by (src_country) ( count_over_time( {job="syslog", log_type="firewall", action="block"}[1h] ) ) - Detect countries with a sudden spike (last 5 min vs last hour):
(
sum by (src_country) (count_over_time({job="syslog", action="block"}[5m]))
/
sum by (src_country) (count_over_time({job="syslog", action="block"}[1h]) / 12)
) > 3
This relative spike detector adapts to your baseline traffic, firing when recent activity is 3x the average.
- View raw events with all parsed fields (JSON log exploration):
{job="syslog", log_type="firewall", action="block"}
| json
| line_format "{{ .src_ip }} → {{ .dst_ip }}:{{ .dst_port }} ({{ .proto_name }}) [{{ .src_country }}]"
These queries empower ad-hoc investigations, complementing the dashboard views.
Part B: Loki Ruler — Recording Rules and Alerting
Loki’s ruler component runs LogQL queries periodically (every 1 minute), enabling both pre-aggregation for dashboards and threshold-based alerting.
How the Ruler Works
- Recording rules compute and store derived metrics in Loki, making them queryable like native time series. This avoids rescanning raw logs for every dashboard refresh.
- Alerting rules evaluate expressions and push firing alerts to Alertmanager.
Recording Rules in Action
Defined in config/loki/rules/fake/firewall_alerts.yaml, these rules create efficient metrics:
| Metric | Description |
|---|---|
| firewall:blocks_by_country:rate5m | Block count per country per 5-min window |
| firewall:blocks_by_interface:rate5m | Block count per interface per 5-min window |
| firewall:blocks_total:rate5m | Total block count per 5-min window |
Tune thresholds by monitoring baselines with queries like sum by (src_country)(count_over_time({job="syslog",action="block"}[5m])) in Explore.
Tenant Note
With auth_enabled: false, Loki uses a “fake” tenant. Rules go in config/loki/rules/fake/.
Volume Path — Why Rules Live Under /etc/loki
Docker Compose mounts ./config/lokito /etc/loki (bind mount, read-only) and uses a named volume for /loki. Place rules in the bind mount for reliability. In local-config.yaml:
ruler:
  storage:
    type: local
    local:
      directory: /etc/loki/rules
  rule_path: /loki/rules-temp
Misconfiguring this leads to errors like “unable to read rule dir /loki/rules/fake”.
Part C: Intelligent Alerting with Grafana
Grafana’s unified alerting handles VictoriaMetrics metrics, integrating seamlessly with Loki alerts via Alertmanager.
Provisioned Alert Rules
From config/grafana/provisioning/alerting/alert_rules.yaml:
Security Alerts (folder: Security Alerts)
| Rule | Query | Threshold | For |
|---|---|---|---|
| High Block Rate From Country (1h) | “sum by (src_country)(increase(firewall_events_total{action=”“block””}[1h]))” | >1000 | 5m |
| Firewall Block Rate Spike (5m) | “sum(increase(firewall_events_total{action=”“block””}[5m]))” | >500 | 3m |
Network Health Alerts (folder: Network Alerts)
| Rule | Query | Condition | For |
|---|---|---|---|
| Network Switch Rebooted | “delta(system_uptime{device_role=”“home_switch””}[5m])” | < -60s | 0m |
| Network Switch Low Uptime | “min(system_uptime{device_role=”“home_switch””})” | < 600s | 2m |
| Network Device SNMP Unreachable | “count(system_uptime{device_role=”“home_switch””})” | no data | 5m |
Notification Policies
From config/grafana/provisioning/alerting/notification_policies.yaml:
1
2
3
4
All alerts → Discord (default, 4h repeat)
  ├─ severity=critical → Discord (1h repeat, group_wait 10s)
  ├─ team=security     → Discord (4h repeat)
  └─ team=network      → Discord (6h repeat)
Setting Up Discord Notifications
- Create a Discord webhook in your server settings and copy the URL.
- Add to
.env:DISCORD_WEBHOOK_URL=https://discord.com/api/webhooks/ID/TOKEN - Apply:
docker compose up -d --force-recreate grafana - Test via API:Bash
1
2
3
4
curl -s -u admin:admin \
  -X POST "http://localhost:3000/api/v1/provisioning/contact-points/convergence-discord/test" \
  -H "Content-Type: application/json" \
  -d '{}'
Contact Points
From config/grafana/provisioning/alerting/contact_points.yaml:
| Name | Type | Purpose | |||
|---|---|---|---|---|---|
| Discord | discord | Primary alert destination — reads ${DISCORD_WEBHOOK_URL} from env | |||
| Webhook | webhook | “Generic HTTP endpoint (Slack | custom scripts | n8n | etc.)” |
| Email notifications — requires SMTP env vars in docker-compose.yml | |||||
| Do Nothing | webhook | Silently drops alerts — useful for testing routing rules |
Provisioned points show with a lock icon in Grafana. Use the API to verify: curl -s -u admin:admin http://localhost:3000/api/v1/provisioning/contact-points.
Alertmanager
Access at http://localhost:9093. Configure webhooks or email in config/alertmanager/alertmanager.yml, then restart: docker compose restart alertmanager.
Part D: Dashboard Organization and New Panels
We’ve restructured for scalability, provisioning dashboards into folders.
Folder Structure
Host path,Grafana folder,Contents dashboards/network/,Network,”SNMP monitoring, interface stats, device health” dashboards/security/,Security,”Firewall events, geo-visualization, threat analysis” dashboards/cisco/,Vendor - Cisco,(reserved for future Cisco-specific dashboards) dashboards/juniper/,Vendor - Juniper,(reserved) dashboards/arista/,Vendor - Arista,(reserved)
Config in config/grafana/provisioning/dashboards/convergence.yaml. Alert folders are auto-created.
Dashboard Inventory
Security Folder
pfSense Firewall Security (pfsense-firewall-security.json)
| Panel | Type | Query / Purpose | |
|---|---|---|---|
| Blocked Events Rate | gauge | “sum(rate(firewall_events_total{action=""block""}[5m]))” |
|
| WAN Threats — Internet Attacks | geomap | “Block events from public IPs | sized by count coloured by count” |
| Traffic Destinations | geomap | “All traffic destinations (red = blocked | green = passed)” |
| All Blocked Source IPs | geomap | All block origins across all interfaces | |
| Firewall Actions Over Time | timeseries | Pass vs block rate over time | |
| Top 100 Blocked Source IPs | table | topk(100, sum by (src_ip,...)) |
|
| Blocked Traffic by Protocol | piechart | sum by (proto_name) |
|
| Traffic by Interface | barchart | sum by (interface) |
|
| Top Blocked Destination IPs | timeseries | What internal IPs are being targeted | |
| Recent Firewall Events Summary | table | Latest block/pass events |
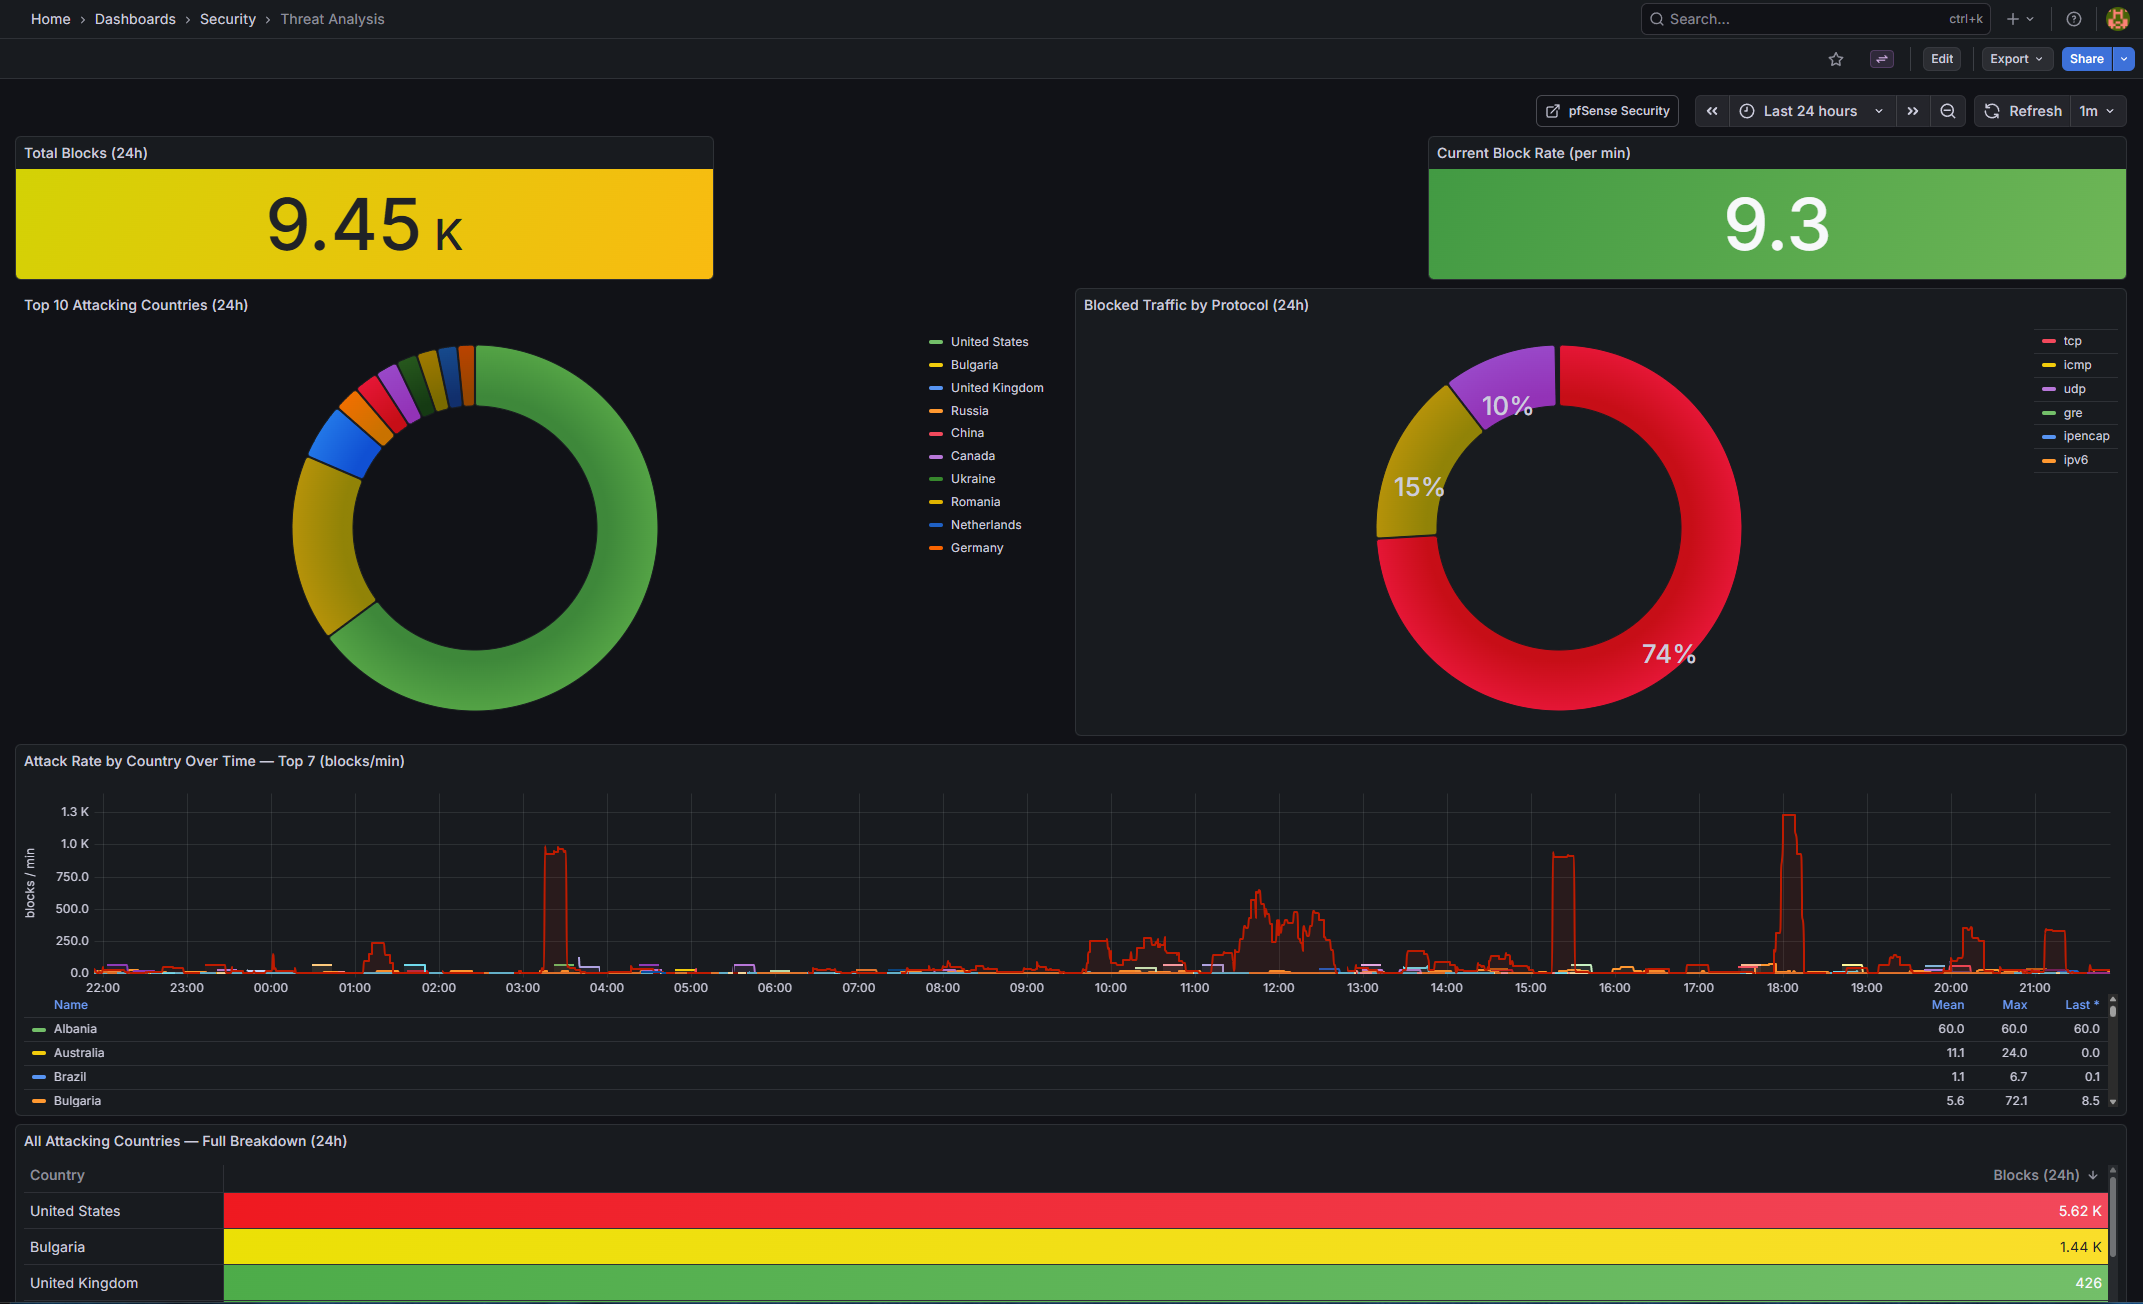
Threat Analysis (threat-analysis.json) (new)
| Panel | Type | Query / Purpose | |
|---|---|---|---|
| Total Blocks (24h) | stat | sum(increase(firewall_events_total{action=""block""}[24h])) — background colour thresholds |
|
| Attacking Countries (24h) | stat | count(sum by (src_country)(...) > 0) — unique source countries |
|
| Current Block Rate | stat | sum(rate(...[5m])) * 60 — blocks per minute |
|
| Top 10 Attacking Countries | barchart (horizontal) | “sort_desc(topk(10 | sum by (src_country)(…[24h])))” |
| Blocked Traffic by Protocol | piechart (donut) | sum by (proto_name)(...[24h]) |
|
| Attack Rate by Country Over Time | timeseries | Top 7 countries, 15m rolling rate, blocks/min | |
| Blocks by Interface Over Time | timeseries (stacked) | All interfaces, shows which is under load | |
| All Attacking Countries | table | Full sortable country breakdown with code and block count |
Network Folder
| Existing: Interface Utilization | Interface Errors | Network Overview | Platform Health. |
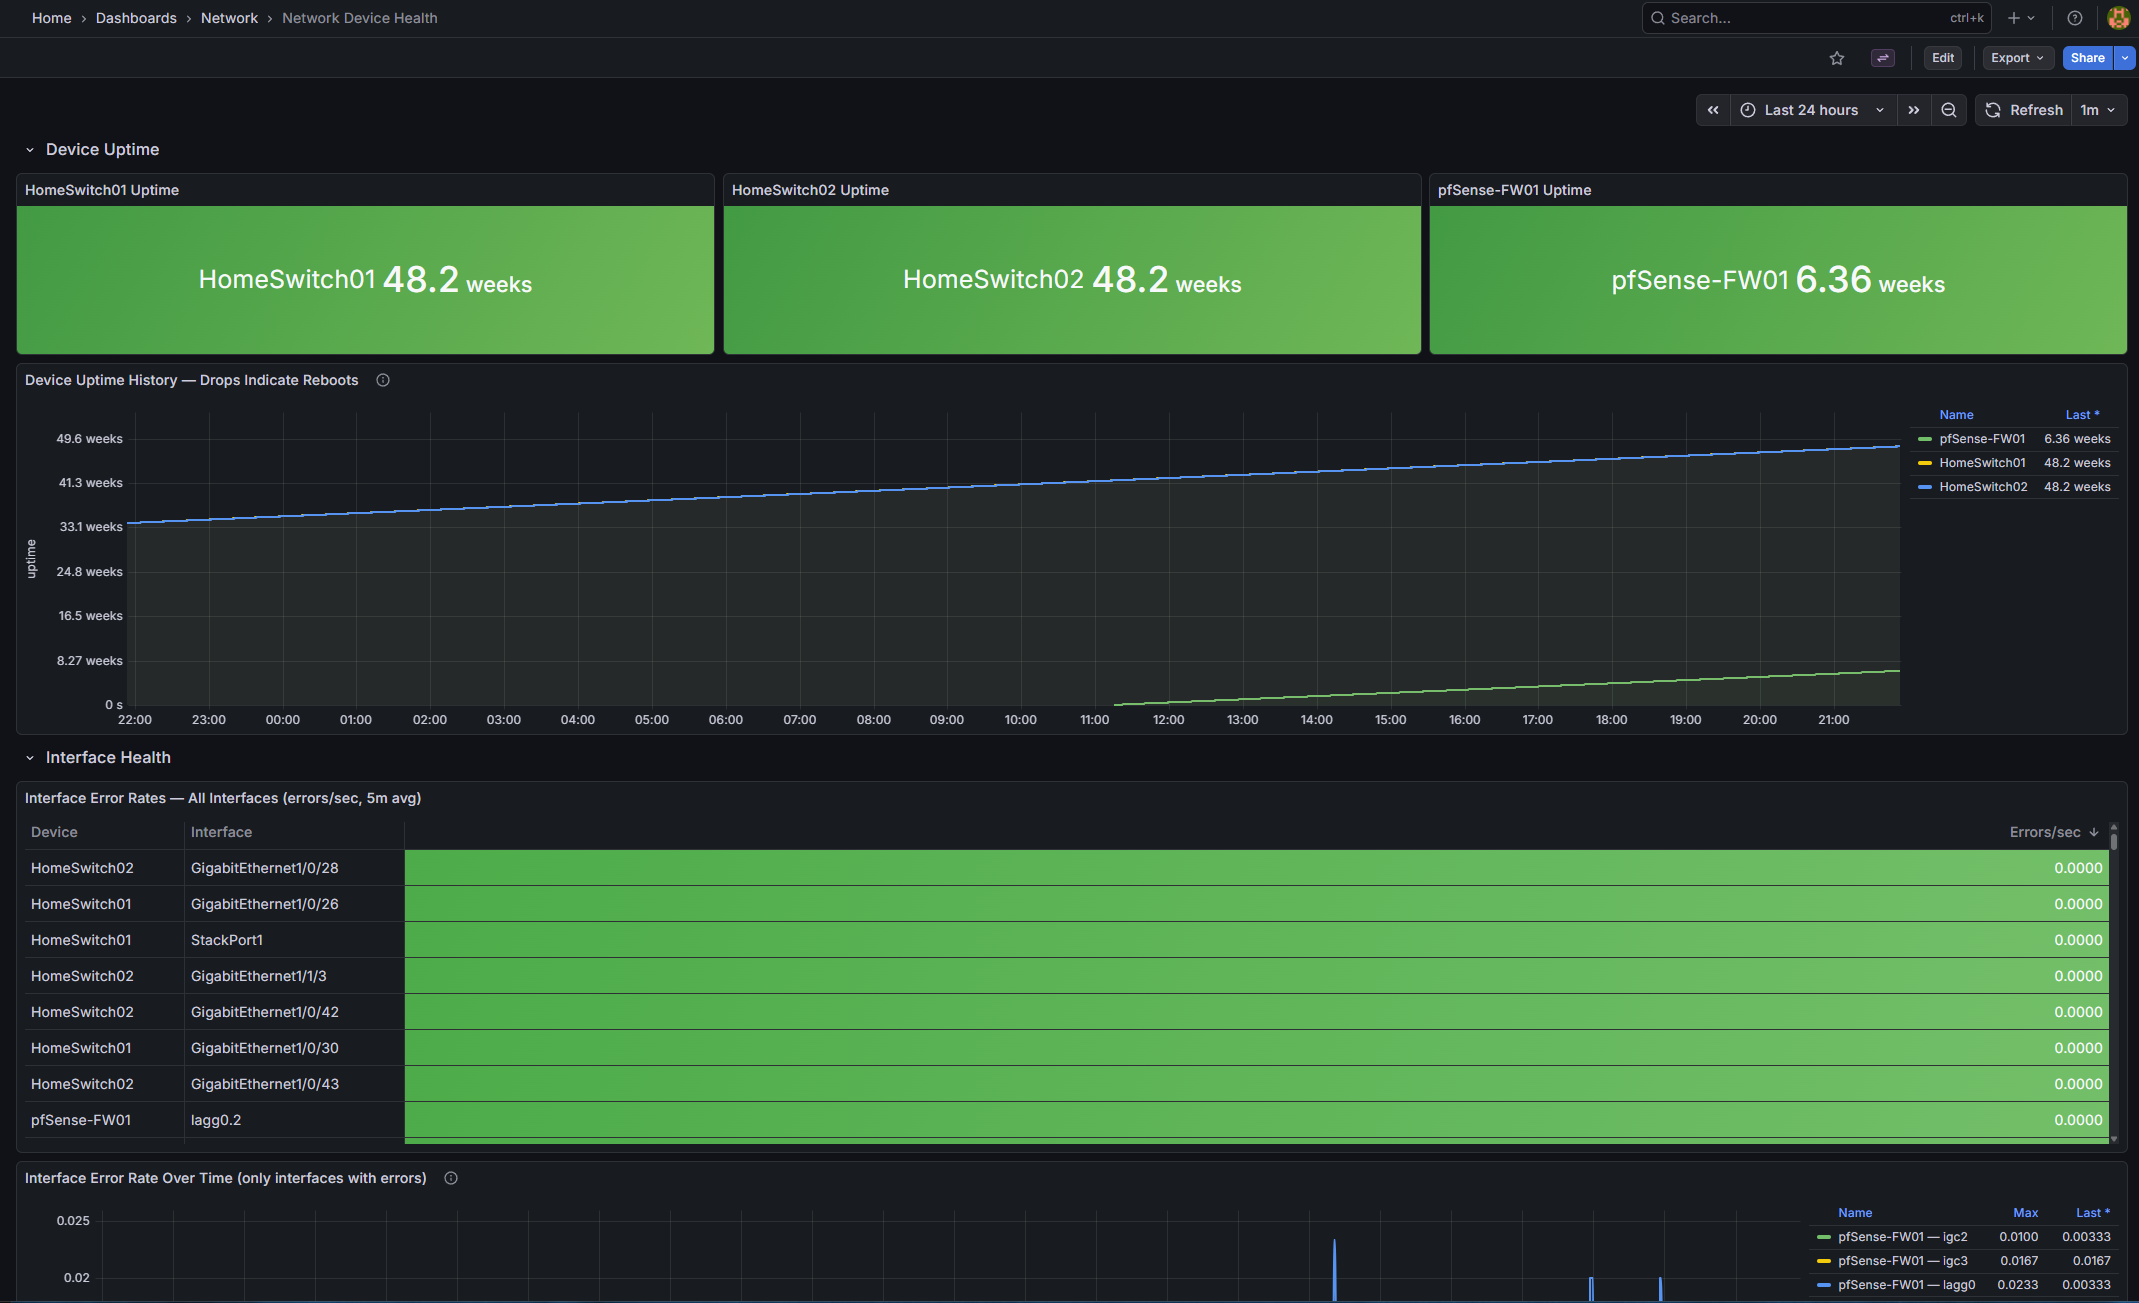
Network Device Health (device-health.json) (new) |
||
|---|---|---|
| Panel | Type | Query / Purpose |
| HomeSwitch01 Uptime | stat | system_uptime{device_name="HomeSwitch01"} / 100 — green ≥1d, orange ≥10m, red <10m” |
| HomeSwitch02 Uptime | stat | Same for HomeSwitch02 |
| pfSense-FW01 Uptime | stat | Same for pfSense-FW01 |
| Device Uptime History | timeseries | All devices — a drop to near-zero indicates a reboot |
| Interface Error Rates (table) | table | rate(interface_in_errors_total[5m]) sorted descending |
| Interface Error Rate Over Time | timeseries | Only interfaces with > 0 active errors are shown |
| Total Bandwidth per Device | timeseries | sum by (device_name)(rate(interface_in_octets_bytes_total[5m])) * 8 IN + OUT |
Note on sysUpTime: SNMP returns centiseconds; divide by 100 for seconds. Adjust if your receiver pre-converts.
pfSense WAN Block Logging — Important Note
pfSense CE 2.7+ removed the UI option for logging default blocks. Add an explicit bottom-of-WAN-ruleset block rule with logging enabled:
| Field | Value |
|---|---|
| Action | Block |
| Interface | WAN |
| Direction | in |
| Protocol | Any |
| Source | Any |
| Destination | Any |
| Log | ✓ checked |
| Description | Default deny - logged |
This logs unsolicited inbound traffic without affecting established connections. Verify in System Logs → Firewall.
Deployment Steps
- Apply changes:
docker compose restart promtail loki alertmanager grafana - Verify Loki labels: In Explore, check
{job="syslog"}for labels likeaction,src_country. - Verify recording rules:
curl http://localhost:3100/loki/api/v1/rulesand queryfirewall:blocks_total:rate5m. - Verify Alertmanager:
curl http://localhost:9093/-/healthy - Set Discord URL: Update
.env, thendocker compose up -d --force-recreate grafana - Test alerts: Use the curl command above.
Troubleshooting
- No labels in Loki: Check OTEL JSON format and Promtail regex. Inspect logs with docker exec.
- Loki no rules: Verify mounts and tenant path. Use docker exec to list files.
- Grafana “No data”: Confirm metrics/labels with VictoriaMetrics API.
- Datasource not found: Update datasourceUid in alert_rules.yaml with actual UIDs (query API), then recreate Grafana.
- Always-firing network alerts: Ensure device_role matches your data; silence if SNMP isn’t set up.
Wrapping Up and Next Steps
Phase 3 transforms our observability stack into a vigilant system that not only visualizes threats but alerts on them intelligently. We’ve enriched IP data for geo-mapping, leveraged Loki for spike detection, and integrated alerting with Discord for quick response.
Looking ahead to Phase 4: AI Threat Intelligence. We’ll explore creating threat intelligence dashboards with automated IP Enrichment, Composite Scoring & Bad-Actor Flagging, Port Attack Analysis, and Claude Haiku Narratives.
If you have questions or suggestions, hit me up on X @byrn_baker or on LinkedIn. Stay tuned!